
Tableau is a leading data visualization tool used for data analysis and business intelligence. Gartner’s Magic Quadrant classified Tableau as a leader for analytics and business intelligence.
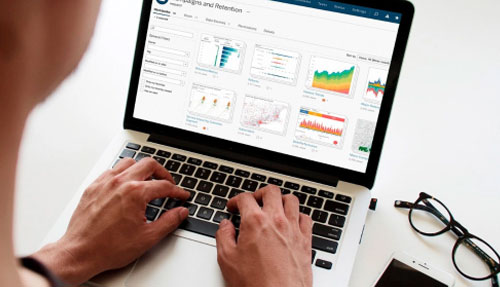
You can easily import your data into Tableau’s data engine from multiple sources and integrate them by combining multiple views in an interactive dashboard.
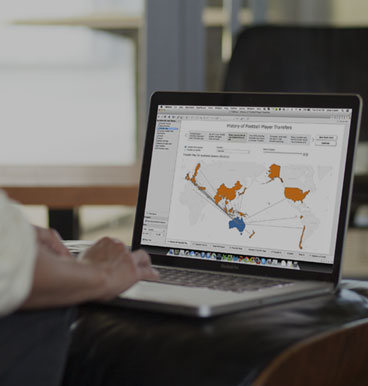
Tableau is many things. However, most importantly, it’s a tool specialized in data visualization.

With Tableau, users develop interactive dashboards and visualizations at ablazing fast pace.
Tableau has extensive visualization types, all geared towards ease of use for the user. It has a far lower learning curve and barriers to entry than alternative visualization software and tools.

Tableau is an absolute data powerhouse with amazing capabilities for handling large data sets with ease.

Avoiding performance issues and ensuring dash board optimization is a considerable push in Tableau.

Tableau dashboards are focused on incredible reporting features with responsive dashboarding opportunities.